Sunday, October 31, 2010

Physics behind Roller Coaster

Roller Coaster
Probably everyone have heard roller coaster and wanted to enjoy a ride. As the train cruising down from a steep hill, did anyone think about the physics behind it? What made the train crusing at a extremely high speed without a motor? What made the train loops 3 or 4 times and not falling off at the middle? They are all about physics and especially the kinetic energy and potential energy. A roller coaster is a very simple machine. The train is first carried up to the top of a lift hill and is from then powered by gravity until it reaches the end of a ride. In a roller coaster, there are two types of energy that decides the success and they are: potential and kinetic evergy. Kinetic energy is the energy of motion. When a object is moving, it has a kinetic energy on it, and when it moves faster, coordinately, a higher kinetic energy. Potential energy is harder to explain but could be simply thought as stored energy. For example, when the train is slowly moving up to the top of a hill, it gains potential energy. This energy is not used until the train start cruising down the hill. When there is more potential energy stored, the faster the train can move. And, when the train is cruising down the hill,the potential energy stored is converted to kinetic energy . The further it cruises down, the more potential energy that gets converted to kinetic energy. In other words, the train picks up speed as it falls. There is a short flash could simulate the increase and decrease of energy in a short and simple roller coaster. Flash to Show Potential and Kinetic Energy

Saturday, October 30, 2010

How to add vectors

Right Triangle Figure 1
How to add vectors? We know that vectors are physical quantities that consist of a magnitude as well as a direction, for example velocity, acceleration, and displacement, as opposed to scalars, which consist of magnitude only, for example speed, distance, or energy. While scalars can be added by adding their magnitudes , vectors are  more complicated to add. When only two vectors are given, first we have to connect those vectors, for example, 4 metre west and 3 metre north. We can choose to draw them on a piece of paper and connect them together to form a right triangle when a hypothetical hypotenuse is added. The second step is to use the Pythagorean Theorem to calculate the length of the hypotenuse.


Pythagorean Theorem Figure 2


And as we calculated, the length is 5 metre. After this step, the final step is to determine the direction and angle to the y-axis. For example, in figure 1, we draw a cross at the starting point, and calculate the angle between the blue line and the y-axis. Figure 3 shows an example. the angle should be calculated is the angle between the y-axis and line A.

Use the equation in Figure 5 and use Figure 4 to determine a right triangle.
Figure 5
Figure 3
Figure 4


However, the above information are just the simplest part of adding vectors. When more and more vectors are given, how to add them all together and find the hypotenuse and angle? In such question, when 3 vectors are given and they are 5 metre 30 degree west north, 3 metre 60 degree east north and 10 metre 20 degree west south, how to solve it? This time a more complicated method would be introduced. We will add them all together, but before that we have to classify the y and x for those hypotenuses given. In figure 3, the vertical dotted line is call the y of a hypotenuse, and the horizontal dotted line is called the x of a hypotenuse. When they are all together, a right triangle could be formed. When the length of a hypotenuse and the angle are given, we use the equations introduced in the below diagram to calculate the adjacent and opposite lines.

Figure 6


When we have found all of the x and y, we will add then together and get a final x and y. We then plot them on a piece of graph paper. The shape formed by plotting the x and y can simply be the one showed in Figure 1. Since x and y are the opposite and adjacent line of the triangle, we can easily find the hypotenuse by using figure 5's equation. Lastly, we repeat the same step for finding the angle and write the answer like 20m (N 30 degree S)


Friday, October 22, 2010

How to derive equation 3 and 4 by using a graph? It is simple! imagine a trapezoid on a graph. Since the trapezoid is composed of a right triangle and a rectangle shaped figure, we can actually simply add the area of the right triangle and the rectangle for equation three:

Area for rectangle:  (v1)(t)
Area for right triangle:   (v2-v1)(t)/2

So, after combining these two results, the equation would be: 
d = v1t + ½(v2-v1)t
Because at = v2-v1 the next step would be substituting this equation into the one above. So it becomes:  d = v1t + ½at(t). As we continue, the final equation which is the third equation would be d = v1t + ½at²


Equation Four


This time, we change our steps for finding the area of the trapezoid. We previously used addition to find the area, therefore this time we will be using subtraction. We first calculate the total area of a rectangle which is the trapezoid, but we see it as a rectangle. The equation will be: (v2)(t). In order for us to get the correct area of the trapezoid, we have to subtract the excessive area we included. So the excessive area would be: (v2-v1)(t)/2
Again, since at = v2-v1, we substitute this into the result we got from above and the equation would be like: d = v2t-½(v2-v1)t, then, 
d = v2t-½at(t), continue to d = v2t-½at², and we are done!

Tuesday, October 12, 2010

Motion

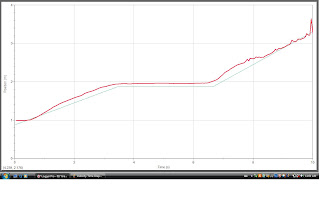
  • This is a d->t (distance and time) graph.
  • When line is horizontal, it represents immobility, thus stay at one spot.
  • When the line has an inclining slope, it means moving backward from the senor in this case.
  • When the line has a declining slope, it means moving oppositely of backward, so in this case, move forward towards the sensor.
1. Stand 1 meter away from the origin, and stay for 1 second.
2.Walk 1.5 meter away from the origin in 2 seconds with constant speed.
3. Stand 2.5 meter away from the origin, and stay for 3 seconds.
4. Walk 0.75 meter toward the origin in 1.5 seconds with constant speed.
5. Stand 1.75 meter away from the origin, and stay for 2.5 seconds.

This is a d->t graph
         1. Stand 3 meter away from the origin, and walk 1.5 meter toward the origin in 3 seconds, with constant speed.
           2. Stand 1.5 meter away from the origin, and stay for 1 second.
           3. Walk 1 meter toward the origin in 1 second with constant speed.

           4. Stand 0.5 meter away from the origin, and stay for 2 seconds.

           5. Walk 2 meter away from the origin in 3 seconds.
1. Stand 0.8 meter away from the origin, and walk 1 meter away from the origin in 3.5 seconds with constant speed.
2. Stand 1.8 meter away from the origin, and stay for 3 seconds.
3. Walk 1.3 meter away from the origin in 3 seconds.

This is a v->t (velocity and time) graph
  • Postive and constant line represents a constant velocity moving away from the sensor
  • Negative and constant line represents a constant velocity moving West (toward the sensor)
  • Sudden increase or decrease in the value of the line means a dramatic acceleration or deceleration.
1. Speed up for 4 seconds.
 2. Walk at a speed of 0.5m/s and move away from the origin for 2 seconds.
3. Walk at a speed of 0.4m/s and move toward the origin for 3 seconds.
4. Stay for 1 second.

Translation from Velocity to Acceleration
1. The acceleration is 0.1m/s^2, and the line is on the positive side.
2. There is no acceleration.
3. There is no acceleration.
4. There is no acceleration.

This is a velocity-time graph
1. Stay for 2 seconds.
2. Walk at a velocity of 0.5m/s away from the origin for 3 seconds.
3. Stay for 2 seconds.
4. Walk at a velocity of 0.5m/s toward the origin for 3 seconds.

Translation from Velocity to Acceleration
1. There is no acceleration.
2. There is no acceleration.
3. There is no acceleration.
4. There is no acceleration.


This is an acceleration graph
Translation from Acceleration to Velocity
1. Walk at a velocity of 0.35m/s away from the origin for 3 seconds.
2. Speed up, still away from the origin, for 0.25 second.
3. Slow down, now toward the origin, for 0.25 second.
4. Walk at a velocity of 0.35m/s toward the origin for 3 seconds.
5. Slow down, toward the origin, for 0.25 second.
6. Stay for 3 seconds.

1. There is no acceleration.
2. The line is on the negative side.
3. The line is on the negative side.
4. There is no acceleration.
5. The line is on the positive side.
6. There is no acceleration.